training and placements Summary
Placement and Higher Education Summary

| Rajarshi Shahu College of Pharmacy, Buldana | ||||||
| Placement and Higher Education Data | ||||||
| PG | ||||||
| Sr. No. | Year | Placement | Higher education | Total | Out of | % |
| 1 | 2022-23 | 27 | 2 | 29 | 41 | 71 |
| 2 | 2021-22 | 38 | 0 | 38 | 41 | 93 |
| 3 | 2020-21 | 30 | 0 | 30 | 30 | 100 |
| 4 | 2019-20 | 3 | 0 | 3 | 3 | 100 |
| 5 | 2018-19 | 2 | 0 | 2 | 2 | 100 |
| 6 | 2017-18 | 7 | 0 | 7 | 7 | 100 |
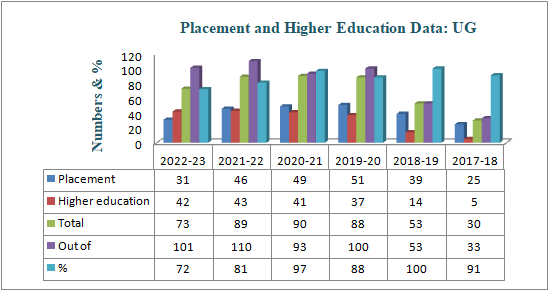
| UG | ||||||
| Sr. No. | Year | Placement | Higher education | Total | Out of | % |
| 1 | 2022-23 | 31 | 42 | 73 | 101 | 72 |
| 2 | 2021-22 | 46 | 43 | 89 | 110 | 81 |
| 3 | 2020-21 | 49 | 41 | 90 | 93 | 97 |
| 4 | 2019-20 | 51 | 37 | 88 | 100 | 88 |
| 5 | 2018-19 | 39 | 14 | 53 | 53 | 100 |
| 6 | 2017-18 | 25 | 5 | 30 | 33 | 91 |
training and placements Summary
Progression | Number of students |
Higher education | 41 |
Pharmacist | 23 |
Marketing | 7 |
Teaching | 7 |
Production/QA-QC | 6 |
PV/DM | 6 |


Progression | Number of students |
Higher education | 37 |
Marketing | 23 |
Production/QA-QC | 17 |
PV/DM | 15 |
Pharmacist | 6 |


Progression | Number of students |
Higher education | 14 |
Pharmacist | 14 |
Production/QA-QC | 10 |
Marketing | 8 |
PV/DM | 3 |
Entrepreneurship | 3 |
Teaching | 1 |


Progression | Number of students |
Production/QA-QC | 7 |
Marketing | 7 |
PV/DM | 7 |
Pharmacist | 6 |
Higher education | 6 |


Placement and Higher Education Summary
UG:
Year | No. of students graduating in minimum stipulated time | Placement | Higher education | Total |
2020-21 | 93 | 49 | 41 | 90 |
2019-20 | 100 | 61 | 37 | 98 |
2018-19 | 53 | 39 | 14 | 53 |
PG:
Year | No. of students graduating in minimum stipulated time | Placement | Higher education | Total |
2020-21 | 30 | 30 | – | 30 |
2019-20 | 3 | 3 | – | 3 |
2018-19 | 2 | 2 | – | 2 |
training and placements Summary
Placements 2020-21
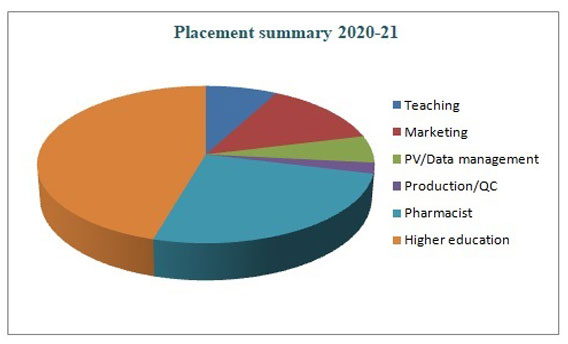
Placement Summary Report for 2020-21
Placements 2019-20
Placement Summary Report for 2019-20
Placements 2018-19
Placement Summary Report for 2018-19
Placements 2017-18
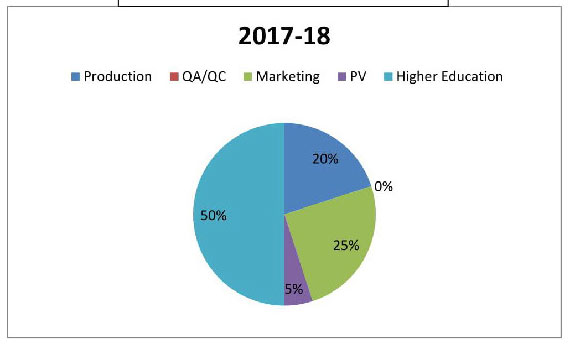
Placement Summary Report for 2017-18
Placements 2016-17
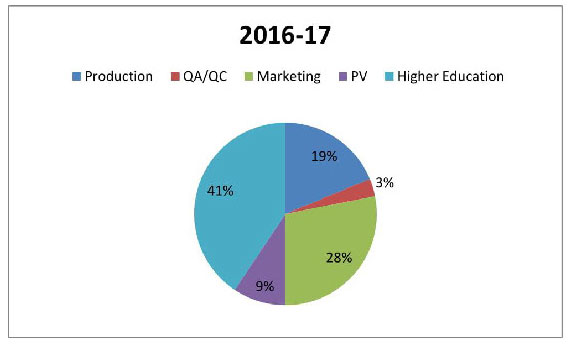
Placement Summary Report for 2016-17
Placements 2015-16
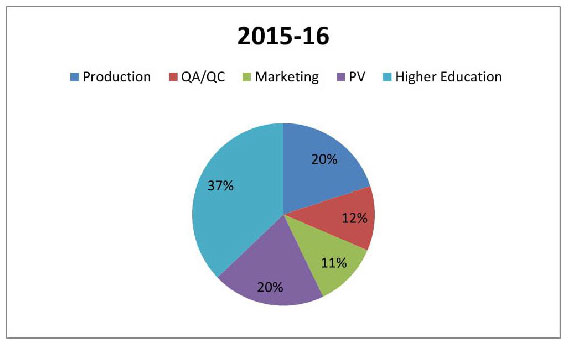
Placement Summary Report for 2015-16
Placement and Higher Education Summary
UG:
Year | No. of students graduating in minimum stipulated time | Placement | Higher education | Total |
2020-21 | 93 | 49 | 41 | 90 |
2019-20 | 100 | 61 | 37 | 98 |
2018-19 | 53 | 39 | 14 | 53 |
PG:
Year | No. of students graduating in minimum stipulated time | Placement | Higher education | Total |
2020-21 | 30 | 30 | – | 30 |
2019-20 | 3 | 3 | – | 3 |
2018-19 | 2 | 2 | – | 2 |
Placements Data


